Appearance
Beyond Elo: Building a Blood Bowl Rating and Prediction Model
This project began with a simple question: Who would win this game?
At first, that sounds like a rating problem. Blood Bowl already has familiar ways to estimate coach strength. Elo is simple, intuitive, and useful: win and your rating rises, lose and it falls, draw and you land somewhere in between. Glicko improves on the same basic idea by also tracking uncertainty.
But predicting an actual Blood Bowl game asks more of a model than ranking the two coaches. One coach rating is being asked to explain too much.
The coach matters, but so does the roster. A roster's effective strength may change as a team develops, and two equally strong coaches can produce very different matchups depending on what they are playing, how developed the teams are, and how much team value separates them. Draws also need to be treated as outcomes in their own right, and some coaches and rosters appear persistently more or less draw-prone than others.
I could not find an existing rating system that combined all of those pieces. As the predictor developed, it borrowed useful ideas from established methods, while repeatable patterns in the games kept revealing where something more was needed.
Over more than three years, that process produced a model with several connected parts: coach and roster strength, uncertainty, coach and roster draw tendency, plus a team-value extension where team-value data is available.
The result is both a prediction model and a new set of rankings. The rankings are useful on their own, but they also have a deeper role: they are the quantities the model learned in order to explain and predict games.
All of those pieces serve the same goal:
Before a game begins, using only information available at that moment, how likely is each side to win, and how likely is the game to be a draw?
This overview is a map of that model. The three articles that follow explain how each part was tested, what problem it solves, and why it earned its place.
The model at a glance
At its core, the model separates strength from draw tendency. One side of the model estimates which team is stronger; the other asks whether the matchup is more or less draw-prone than that strength difference alone would suggest.
The strength difference is
where:
is Coach Rating; is Roster Rating.
Where richer pregame team-value data is available, roster strength can vary with TV and the matchup can include an additional deterministic TV correction:
Draw tendency is modeled separately through
where:
is Coach Draw tendency; is Roster Draw tendency.
Here,
The final pregame probabilities are then
So the model is really asking two different questions at once:
Who is stronger?
and
How draw-prone is this matchup beyond strength alone?
Coach Rating and Roster Rating
A coach-only rating has to absorb every systematic effect on results, even when that effect actually comes from the roster being played.
The model therefore separates coach strength from roster strength:
This lets the model ask:
How strong is this coach?
and separately:
How strong is this roster, after accounting for who is coaching it?
Roster Rating is not a win-rate table. It is inferred jointly with Coach Rating through the chronological sequence of games. The main development story behind that separation, together with the uncertainty model and the core Davidson framework, is covered in: Beyond Elo, Part I: The Core Rating Model
A note on official and non-official rosters
FUMBBL includes both official Blood Bowl rosters and a much larger set of custom or non-official rosters created for leagues and special rulesets. That distinction matters for a few parts of the model.
Every roster can have a Roster Rating, but the richer roster-specific extensions are limited to official rosters. Official rosters can have strength that varies with team value through (RR(TV)), and they can have their own learned Roster Draw tendency. Custom rosters currently use a single Roster Rating and do not have a separate roster draw state.
This is mainly a FUMBBL-specific detail. When the rest of the series refers simply to “rosters,” it means both unless the distinction matters.
Uncertainty is part of every rating
Each learned rating has both a current value and an uncertainty around that value. A new or poorly observed coach should be able to move more after one result than a coach with hundreds of games, and the same applies to roster strength.
Rather than assigning every game the same fixed update size, the model lets less certain ratings move more when new evidence arrives. As evidence accumulates, uncertainty usually falls and individual results normally have less influence, although evolving strength ratings retain some uncertainty over time. The same uncertainty framework is used throughout the model, with different rating types allowed to evolve differently.
Draws are not just half a win
Davidson already gives the model a genuine three-outcome prediction:
It naturally makes close matchups more draw-prone than mismatches.
But during development, residual analysis showed something more. A residual is simply the part of a result that the current model did not explain. In this case, some coaches and some rosters repeatedly drew more or less often than the strength model expected. That pattern persisted into later games, which justified giving draw tendency its own learned ratings.
The model therefore uses
Coach Draw and Roster Draw do not automatically mean defensive, conservative, or stall-heavy. They mean only that games involving that coach or roster tend to draw more or less often than the strength model alone predicts.
The discovery and validation of that signal is covered in: Beyond Elo, Part II: Learning Draw Tendency
When roster strength depends on team value
Where pregame TV is available, one scalar Roster Rating is not always enough. A roster can behave differently at different stages of development, so the model allows roster strength to become a function of team value:
Instead of assigning one fixed strength value to a roster, the model learns several latent control points over team value and interpolates between them. In other words, it asks how strong that roster appears to be at its current stage of development.
But even after accounting for
These two effects are related but distinct.
Those extensions are covered in Beyond Elo, Part III: When Roster Strength Depends on Team Value.
Everything is chronological
One rule runs through the entire project:
A game must be predicted before its result is allowed to affect the model.
Within each chronological replay, a game is predicted before its result can update any learned state. The result can affect later ratings, but not the ratings used for that game's own prediction. Part I shows the full prediction-and-update sequence.
Did the added structure help?
Each addition to the model was motivated by something the simpler version was failing to explain. But because the original goal is prediction, those additions also need to improve the probabilities produced before a game begins.
The comparison is slightly different between the two rankings. Both use the same core model described in Parts I and II, but they learn from different datasets. FUMBBL also records pregame team value, allowing the Part III extension to use
The added structure improved predictions in both datasets. In NAF game data, the complete core model increased the geometric-mean probability assigned to the result that actually happened by about 1.45% relative to the coach-only baseline. In FUMBBL game data, with the additional team-value information available, the increase was about 2.42%.
The comparison uses Log Loss, a technical measure that rewards assigning more probability to the result that occurs. Lower is better: NAF improved from
That does not prove the model is optimal, or that every coach-only Elo or Glicko implementation is inferior. It is narrower evidence that the added structure improves chronological probabilistic prediction while remaining interpretable.
The development rule behind all of it
The final equations make the model look much cleaner than the development process really was.
Different update rules were tried. Different draw formulations were tried. Different uncertainty structures were tried. Different ways of representing team value were tried.
Some improved one metric but behaved badly elsewhere. Some were mathematically attractive but added complexity without enough evidence. Others had to be rewritten after deeper mathematical audits.
The recurring development rule became:
Observe a failure, form a hypothesis, build a test, and keep the effect only if it survives.
Coach Rating, Roster Rating, uncertainty, draw tendency, RR(TV), and delta TV were all added for the same reason: the simpler model was still missing something repeatable in the data.
Read the full series
Part I
Beyond Elo, Part I: The Core Rating Model
Coach Rating, Roster Rating, Davidson win/draw/loss probabilities, Gaussian uncertainty, chronological updating, and the core model.
Part II
Beyond Elo, Part II: Learning Draw Tendency
How draw residuals revealed persistent coach and roster draw behavior, and why the model gained separate CD and RD states.
Part III
Beyond Elo, Part III: When Roster Strength Depends on Team Value
How roster strength became
Explore the live rankings and predictor
The model described in this series is live in Analytics. The rankings update automatically as the underlying game data is processed. You can switch between the FUMBBL and NAF rankings, with each view showing the latest game included in its current data.
- Roster rankings let you compare rosters under BB2020 and BB2025. In the FUMBBL view, you can choose a TV point to see how the ranking changes across development stages.
- Coach rankings provide a searchable, sortable list of coaches with their games, Coach Rating, and draw rating.
- Rating histories let you follow coach and roster ratings over time or by games played. The history views also show coach and roster draw-rating histories, and let you compare selected rosters.
- Game Predictor combines selected or manually adjusted coach ratings, rosters, team values, and draw ratings into pregame win, draw, and loss probabilities. It also shows how coach strength, roster strength, team value, and draw tendency shape the matchup.
- Game Analysis lets you enter a processed FUMBBL match ID or link to revisit its pregame prediction, see the model's factor breakdown, compare the result with expectation, and inspect the rating movements that followed.
The tools are a way to explore the ideas in this series through real games: how coaches and rosters are rated, how those ratings have developed, and how they combine in a specific matchup. Figure 2 shows the resulting three-outcome prediction for one pairing.
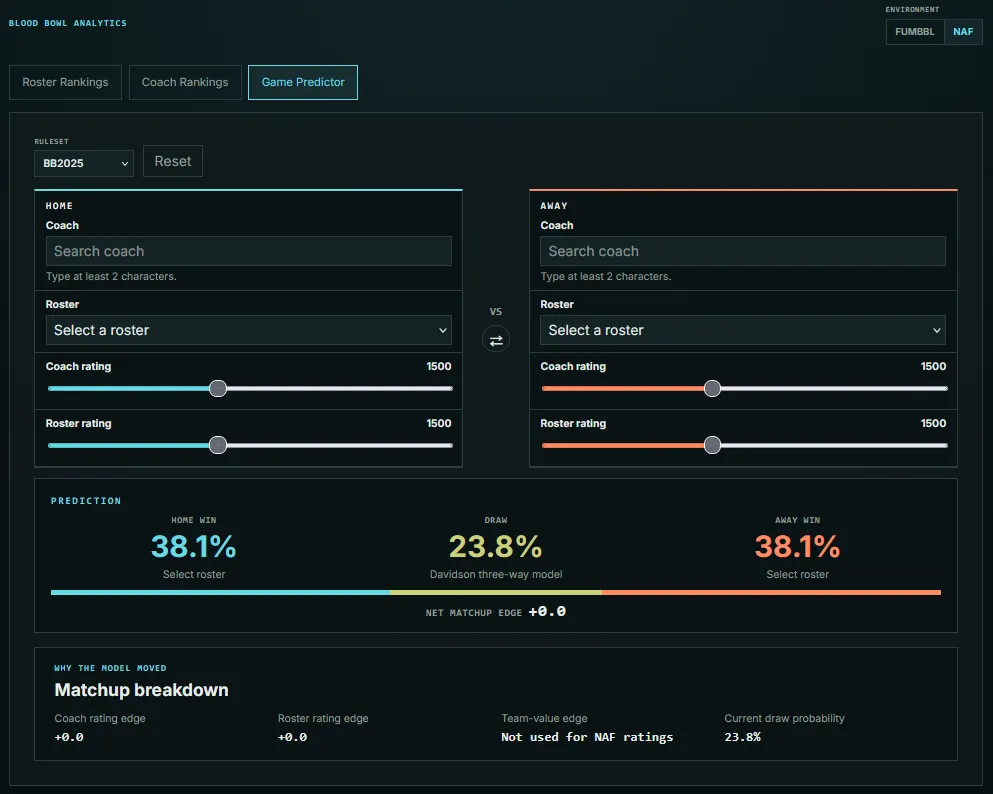
Figure 2. Example three-outcome matchup predictor.
The model is still a prediction model first. The ratings are useful because they are the internal quantities the model needs to explain and predict real games.
Technical references
For readers who want the derivations rather than the development story:
- Core Davidson Model covers the three-outcome prediction model and strength states.
- Draw Tendency and the Joint Update covers CD/RD, coupled inference, and uncertainty.
- Roster Strength by Team Value covers
control points and their updates. - Delta-TV Matchup Correction covers the deterministic team-value-difference term.
Updates
Update, October 1, 2026: Clarified the scope of official-roster extensions, the uncertainty and chronological-update descriptions, and the interpretation of the reported prediction improvements.