Appearance
Beyond Elo, Part II: Learning Draw Tendency
The core Davidson model already treats draws as a genuine third outcome. Close games are naturally more draw-prone than mismatches, so a high raw draw rate does not by itself tell us that a coach or roster has any special tendency to draw.
The more interesting question was what remained after strength had already explained as much as it could:
Do some coaches still draw more or less often than expected?
And if they do, the same question can be asked of rosters.
The next step was to test a simple empirical question: is there repeatable draw behaviour left over after accounting for strength?
How we tested draw tendency
The starting point was a strength-only Davidson model with draw ratings disabled. To make the comparison fair, the baseline was refitted from scratch, allowing the remaining strength and baseline draw parameters to settle again rather than simply taking a model fitted with draw ratings and switching them off.
For each game, the strength model already supplied a draw probability
where
A positive residual means the game produced more draw outcome than the strength model expected; a negative residual means less.
A single game tells us almost nothing because draws are noisy. The more useful question is whether those residuals persist for the same coach or roster. For coaches with enough games, I ordered their games chronologically, split the history in half, calculated the mean draw residual in the first half, and compared it with the mean residual in the second half. The same analysis was repeated for rosters.
If the apparent draw tendencies were only noise, first-half residuals should tell us little about second-half residuals. Instead, the structure persisted: coaches that drew unusually often relative to the strength model tended to continue doing so later, and rosters showed the same kind of pattern.
That persistence was the key result. It showed that there was repeatable draw behavior left over after strength had already explained what it could, which justified giving draw tendency its own latent states.
Coach Draw and Roster Draw
The model now separates draw tendency in the same spirit that it separates coach and roster strength.
Rather than rating the draw setting
and the game uses
where:
is Coach Draw tendency; is Roster Draw tendency.
On FUMBBL, separate RD states are currently learned only for official rosters; custom rosters do not have their own roster draw state.
The game-specific draw parameter is then
This gives the model two conceptually different jobs:
There is also a useful connection here. The same residual used in the discovery analysis,
also gives the final model the information it needs to learn whether a coach or roster is more or less draw-prone than expected. The exact Davidson derivation is in the technical reference.
That does not make CD or RD a general measure of playing style. A high value does not automatically mean defensive, conservative, stall-heavy, or anything similar. The interpretation is deliberately narrower: it means only that games involving that coach or roster have shown a persistent tendency to draw more, or less, often than the strength model alone would predict.
What the fitted states look like
The fitted NAF states also show a visible spread around zero rather than collapsing toward a common value. The persistence test above is the evidence that this spread reflects more than random noise.
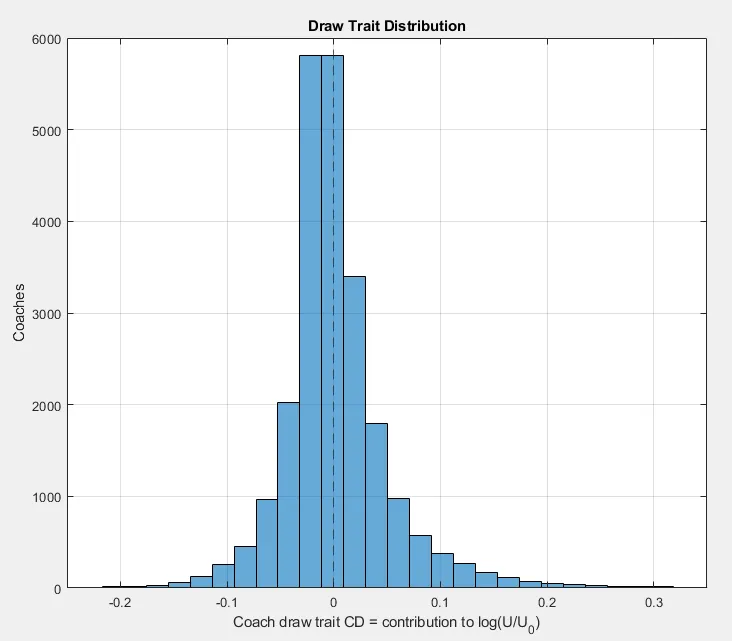
Figure 1. Final coach draw-trait distribution.
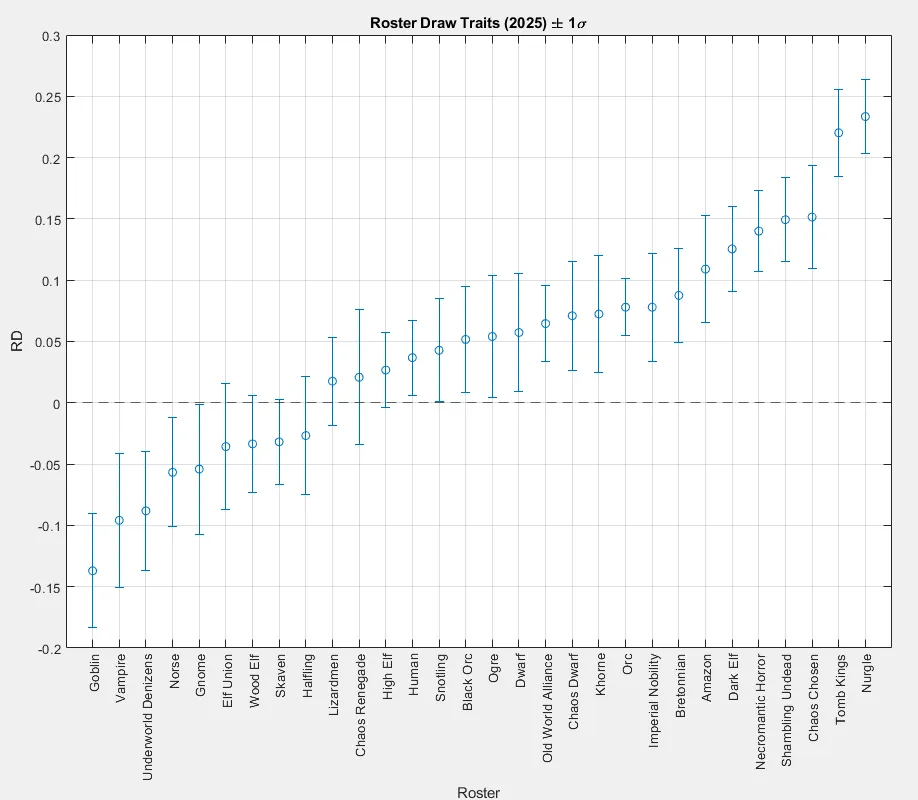
Figure 2. Official-roster RD estimates with uncertainty bars.
The roster states show the same kind of separation. Figure 2 makes it clear that different roster families settle at visibly different draw tendencies, with their uncertainty shown alongside the estimates.
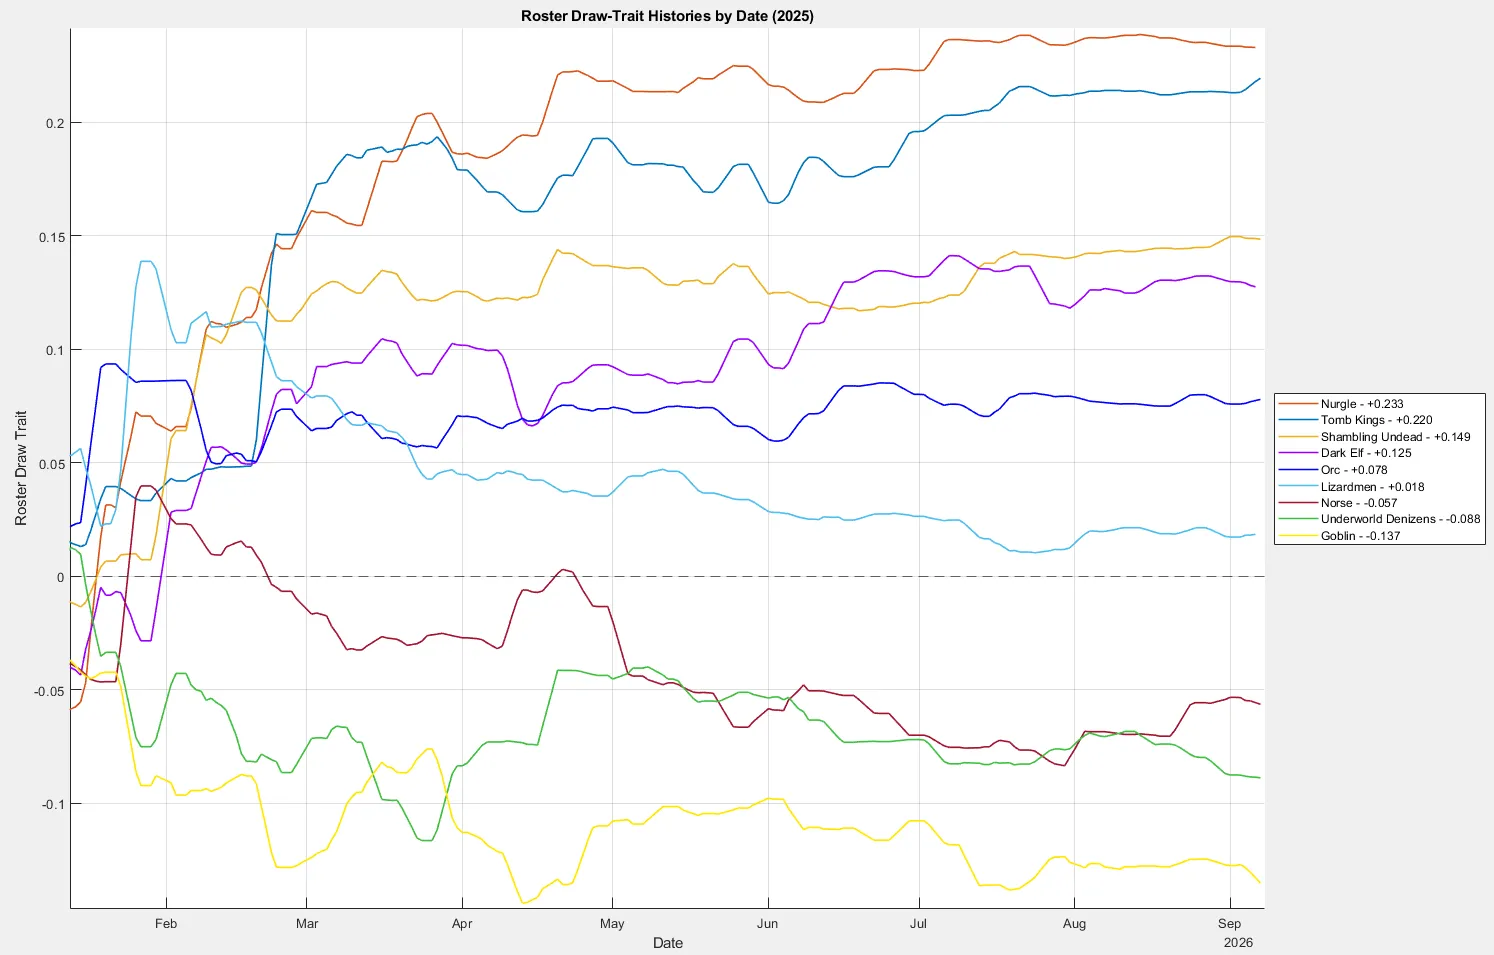
Figure 3. Selected roster draw-trait histories through time.
Perhaps the most intuitive plot is the history itself, shown in Figure 3. Different rosters do not simply wander indefinitely around zero. After early movement, many settle into distinct and relatively stable levels.
That visual behaviour is consistent with the residual analysis that originally motivated the draw subsystem.
Not every effect needs to drift forever
Once coach and roster draw tendencies had been established, the next question was whether those traits needed to keep changing over time.
Are these tendencies constantly drifting, or are they relatively persistent?
That is separate from asking whether draw tendency exists in the first place. To test it, I allowed the draw tendencies to change slightly over time and checked whether that improved predictions. It did not provide useful evidence of continuing drift.
The final model therefore treats CD and RD as persistent learned traits that become better estimated as more games accumulate, rather than states that continually wander over time.
This was another recurring lesson from the project: adding a mechanism because it is possible is not the same as showing that the data actually needs it.
Explore draw tendency
In Analytics, the predictor's draw probability shows how the matchup's current draw environment changes the three possible outcomes. Coach and roster draw ratings and their histories show the learned tendencies behind that prediction.
Technical reference
For the full derivation, see Draw Tendency and the Joint Update.
Updates
Update, October 1, 2026: Clarified that FUMBBL roster draw tendencies are learned only for official rosters; custom rosters do not have separate roster draw states.