Appearance
To Block or Not to Block?
I have always had a fascination with the blockless win.
There is something deeply satisfying about winning a Blood Bowl game while barely blocking at all. Blood Bowl gives blocks enormous weight. We count them, build rosters around them, celebrate removals, and talk constantly about winning the bash war. Yet some coaches seem perfectly comfortable winning games where blocking is barely part of the plan.
That led me to a question that stayed in the back of my mind for a long time: is blocking a style?
A reasonable person might simply compare how many blocks different coaches throw and call it a day. So, naturally, I built another rating system.
Those of you who read Beyond Elo already know I have a habit of turning simple Blood Bowl questions into unnecessarily complicated mathematical models. And somewhere along that particular adventure, I started wondering whether we could measure blocking styles too.
Building a rating system for blocks
The starting point was to separate the influence of the roster from the influence of the coach. Different rosters naturally produce different blocking environments, but there are two sides to that behaviour. A roster can generate opportunities for its own players while also making it easier or harder for the opponent to find blocks. Coaches influence both sides as well, through positioning, tactical choices, and how they use the tools available to them.
That gives us four ratings:
- Roster Generation (RG): how strongly a roster contributes to generating blocks.
- Roster Allowance (RA): how strongly a roster contributes to the blocks its opponent can make.
- Coach Generation (CG): how a coach changes their own team's block generation.
- Coach Allowance (CA): how a coach changes the opponent's block generation.
For each matchup, the model combines the generation ratings of one team with the allowance ratings of its opponent. In mathematical form, the expected number of blocks for Team 1 is
where
The model learns these ratings from historical games. Before each match, it estimates how many blocks each team will generate using only the information available at that moment. It also estimates how much the actual block count might vary from that prediction, accounting for both the uncertainty in its ratings and the natural variation between games. After the game, the observed block counts provide evidence to update the ratings, with newer or less-established coaches and rosters generally changing more quickly than well-established ones.
This approach shares some ideas with the rating system developed in my Beyond Elo project, particularly the separation of coach and roster effects, chronological learning, and uncertainty-aware updates. The difference is what we are trying to predict. Beyond Elo estimates the probabilities of winning, drawing, and losing. Here, the target is the number of blocks each team will throw during regulation time.
Can we actually predict blocks?
Before using the ratings to investigate blocking styles, we should probably check whether the model is any good at predicting blocks in the first place.
Across more than 780,000 team appearances, the model predicted an average of 38.65 blocks, compared with an actual average of 38.61. That's remarkably close, although getting the overall average right is the easy part. The more interesting question is whether the predictions hold up across games with very different blocking environments.
To check this, I grouped team appearances by their predicted block counts and compared those predictions with what actually happened.
| Predicted blocks | Appearances | Predicted avg. | Actual avg. |
|---|---|---|---|
| 20–25 | 35,173 | 23.2 | 23.3 |
| 25–30 | 106,440 | 27.7 | 27.6 |
| 30–35 | 135,220 | 32.5 | 32.5 |
| 35–40 | 150,800 | 37.6 | 37.9 |
| 40–45 | 159,610 | 42.5 | 42.7 |
| 45–50 | 114,980 | 47.3 | 47.1 |
| 50–55 | 53,918 | 52.1 | 51.4 |
| 55–60 | 17,278 | 57.0 | 55.3 |
| 60–65 | 4,226 | 61.9 | 58.9 |
Regulation-time team appearances. The table shows predictions from 20 to 65 blocks; rarer predictions outside that range are omitted.
The agreement is remarkably good across the most common ranges, with predicted and actual averages often differing by less than half a block. At higher block counts, the model starts to overpredict, although those situations are much less common.
Of course, individual Blood Bowl games can go completely off script. An early removal, a quick touchdown, or a particularly chaotic drive can change everything. That's why the model predicts not only how many blocks to expect, but also how much the actual count might differ from that prediction. Those uncertainty estimates also turned out to be remarkably well calibrated.
We also tested whether the four ratings capture behaviour that persists into future games, rather than simply explaining historical results. All four showed predictive value, giving us confidence that they represent meaningful differences between coaches and rosters.
Rosters have blocking styles
Everyone expects Dwarfs and Wood Elves to approach blocking differently. What is interesting is that the model can measure those differences, and they remain remarkably consistent over time.
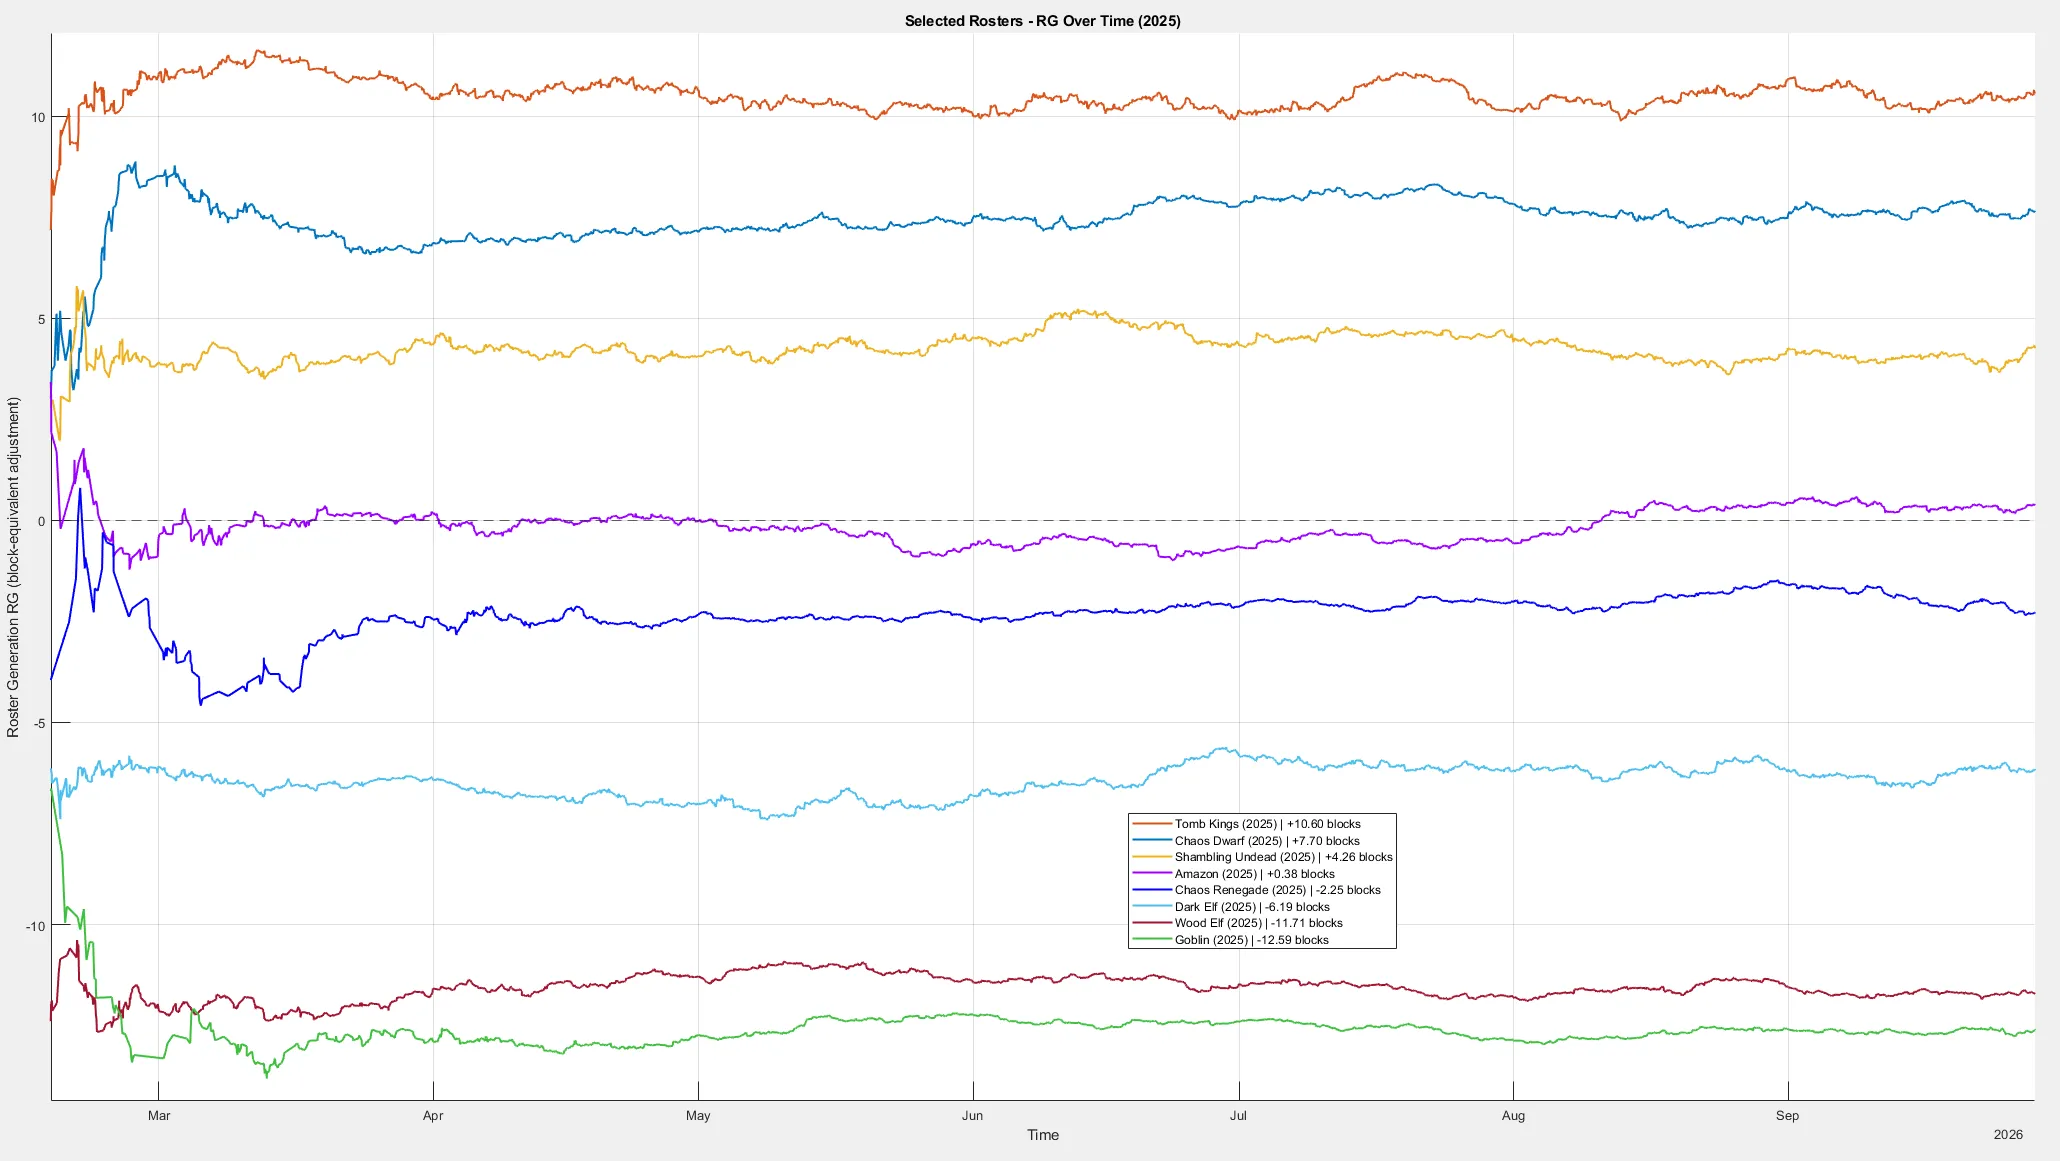
Roster Generation (RG) measures how much a roster contributes to its own block production. In Figure 1, we can see how this rating develops over time for a selection of rosters.
[Figure 1: Roster Generation over time]
Tomb Kings and Chaos Dwarfs consistently generate far more blocks than average, while Wood Elves and Goblins sit at the opposite end. Despite fluctuations, the rosters maintain distinct tendencies throughout the year.
The model also measures Roster Allowance (RA), which captures how much a roster contributes to the blocks its opponents generate. A roster can generate plenty of blocks without necessarily limiting its opponent's opportunities.
Rosters have their own blocking styles. And because these tendencies are so persistent, comparing coaches by raw block counts risks measuring their roster choices rather than their individual behaviour.
So what happens when we separate the two?
Is blocking actually a coaching style?
Once roster effects are separated out, the answer appears to be yes.
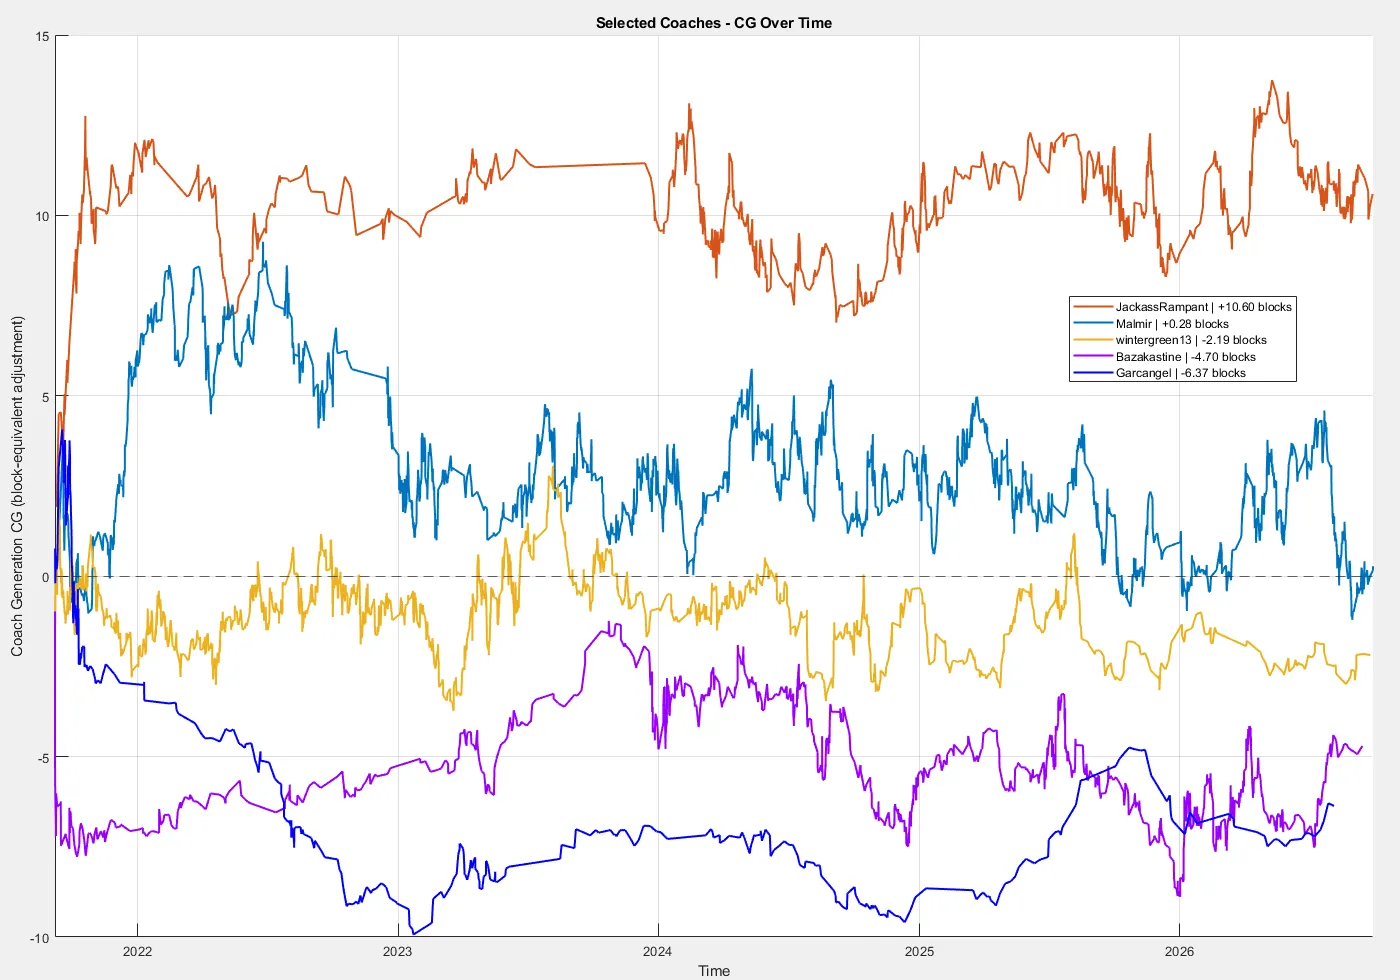
The model still finds persistent differences between coaches. Some consistently generate more blocks than expected for their roster and opposition, while others generate fewer. Figure 2 shows a few examples through Coach Generation (CG), the rating that measures a coach's contribution to their own block production.
[Figure 2: Coach Generation over time]
These are only examples, but they illustrate the broader result: even after accounting for the roster, coaches still show persistent blocking tendencies of their own.
The model also tracks Coach Allowance (CA), which measures how much a coach contributes to the opponent's blocks. That turns out to matter as well, and it will become especially important later when we look at stronger and more successful coaches.
So blocking does appear to be a coaching style. But what about the very best coaches?
Do the best coaches all block alike?
To investigate, I selected the top 10% of established coaches by Coach Rating (CR), using the rating system from Beyond Elo. That gives us 271 coaches, whose Coach Generation (CG) and Coach Allowance (CA) ratings are shown in Figure 3.
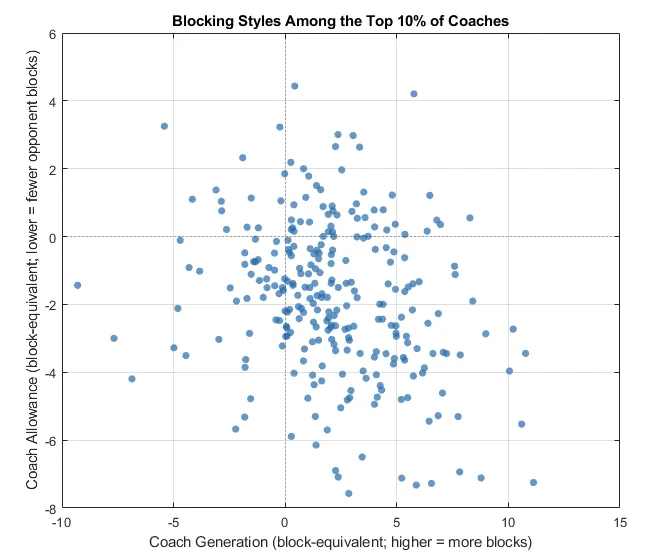
Figure 3: Blocking styles among the top 10% of coaches.
There is a clear tendency. About 52% of these coaches generate more blocks than expected while also restricting their opponents' blocking opportunities. That's the most common combination among the elite.
But the figure also reveals considerable variety. Around 15% generate fewer blocks than expected, another 14% sit close to average generation, and some even allow more blocks than expected. These coaches have reached the same top 10% despite having quite different blocking profiles.
Elite coaches tend to concentrate toward higher generation and lower allowance, but their ratings spread across a wide range rather than forming one narrow group.
There is a typical elite blocking tendency, but there is no single blocking style required to reach the top. Some coaches generate enormous numbers of blocks, others generate relatively few, and both can be exceptionally successful.
So, to block or not to block?
Hell yeah, right? Well, who knows. What we've learned is that even the best coaches don't all agree on how much blocking is enough. And we've barely scratched the surface of what these ratings might tell us.
But at least we can now predict how many blocks you're going to throw. Because apparently Blood Bowl needed another rating system.
You're welcome.
Special thanks to Christer for FUMBBL and its amazing API. Access to all this historical match data is what makes investigations like this possible.
Explore the model
Compare coach and roster ratings, inspect how they changed over time, and build matchup predictions in Analytics.
In the FUMBBL Predictor, enable Blocks to see and adjust the coach and roster factors behind each team's expected blocks. The same Block Prediction Model powers block-line generation in The Underground.